Avant Tecno and Leanware have been working closely together since 2018. Avant Tecno uses the LeanwareMES manufacturing execution system (MES) to collect data on production deviations.
Avant Tecno is a manufacturer of small loaders. According to Production Development Manager Juha Linnusmäki, if an operator detects a deviation in production, they report it in the MES system, from where the data is transferred to the data warehouse. The deviations observed are anything that prevent smooth progress of the manufacturing. Deviations are reported against a standardized process.
“The operators assemble the loaders from an individual list of components. If an operator detects a defective part or other quality problem, they report it in the MES system,” Linnusmäki explains.
The system has been in place at this level for about two years. Avant Tecno’s goal is to improve internal quality and increase productivity. The data management process has clearly paid off, as the targeted annual turnover growth of 15 to 20 percent has been achieved at group level.
The company’s data warehouse receives between 200 and 400 deviation reports per week. According to Linnusmäki, there would simply not be enough time to deal with them all separately, which is why Avant Tecno uses categorization to handle deviations.
“We don’t have to go into each reported deviation individually – instead, we can quickly and easily see from the data visualization where we need to focus our attention. We detect the most frequent deviations with Microsoft Power BI, and it’s those we want to get to the bottom of.”
The deviation data is processed at the end of the week, when the five to ten most critical problems are selected for processing. On Monday, the week starts with a meeting where they are presented, and people are selected to be responsible for each of those deviations in order to try to identify the root cause. The aim is to find the causes of the deviations within a week, says Linnusmäki.
“The aim is always to find the root cause! If they are not identified within the target week and the defect recurs, our cause identification process has not been correct and we will consider a new one. The deviation remains on the board until the problem is solved. This becomes a learning process that helps the organization to understand the operations and the process.”
By “board,” Linnusmäki means a whiteboard on which the reports are presented for joint review and comments by employees. There has been good feedback for the common and clear approach to dealing with defects in the manufacturing process.
“The feedback from management has been that this approach helps to catch recurring problems. At the same time, this has motivated operators to record deviations, because the problems will be dealt with. The operators like it! This system involves everyone, from the operators onwards, in shared data-led development.”
The transformation of data into knowledge-based management requires a coherent process built around data. The data produced by the MES system is processed using focusing, or targeting, according to Linnusmäki. The upper categories in the data system are partial deficiencies and quality deviations, and below them are more detailed targets.
“For example, when it comes to defective parts, the subcategories are self-made and purchased parts, and on the quality side it could be either a welding defect or a painting defect, for instance. This targeting provides us with longitudinal information on factors such as a reduction in shortages of externally sourced parts, and an increase in shortages of self-made parts. This allows us to monitor and understand the development of different parts of the process,” Linnusmäki explains.
He emphasizes that the most important thing in knowledge-based management is to prioritize improvement needs according to the cause-and-effect principle. The key is to generate a process of continuous improvement based on data, and it’s important to be patient with it.
“It must be kept in mind that results come over a long period, months and years.”
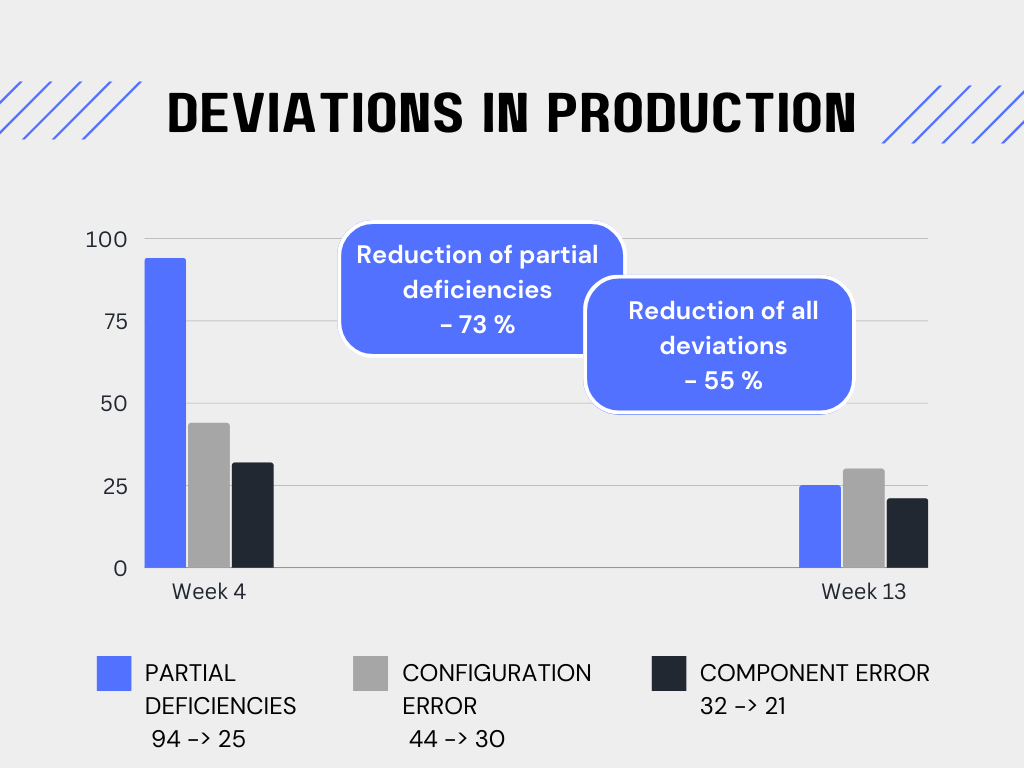
A good example of Avant Tecno’s visualization of defect data is provided by the weekly view in the report. This graph shows the change in the level of deviations at category level from week 4 to week 13. Part defects decreased by 73 percent, assembly defects by 31 percent, and component defects by 34 percent. In all, deviations decreased by an impressive 55 percent.

